Histogram – Definition – Properties – Construction – Examples – Solutions
Histogram
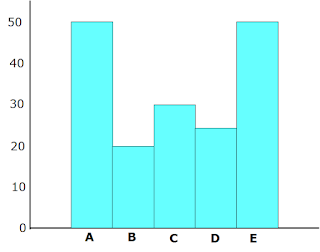
A histogram is from of graphical representation of grouped frequency distribution with continuous classes.
In a histogram data represents like the bar graph, but it there is no gap between rectangular bars. The rectangular bars show the area of proportional to the corresponding frequency of a variable and the width of the bars represents the class intervals or class width.
A histogram shows an accurate representation of the distribution of numerical data.
Properties of Histogram
1. The height of the bars or rectangles are proportional to the corresponding frequencies of similar classes.
2. All bars have a common base.
3. It is an area graph.
4. In a bar graph each bar or column is of equal width and corresponds to the equal class interval.
Construction of a Histogram
1.First draw two perpendicular lines intersecting each other at a point O.
2.The horizontal line is the X axis and the vertical line is the Y axis.
3. To determine the height and width of each bar choose a suitable scale.
4. Draw the bars on the horizontal line, with corresponding heights.
Example: The following table represent the weight of students in a class, create a histogram.


Example: The following table represent the height of adults, create a histogram.

