Bar Graph | Problems and Solutions on Bar Graph
Bar Graph Problems and Solutions
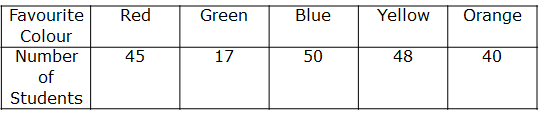
Example: (1) Favourite colour of 200 students of a class are given in the below table.
Answer the following questions with the help of the bar graph.
(1) Which is the most preferred colour and which is the least preferred?
(2) How many students preferred red colour?

Solution: First we choose a suitable scale, start the scale at 0.
The greatest value in the data is 50, so we know that all the bars would lie between 0 and 50, and the
we choose the scale such that the length between 0 and 50 is neither too long nor too small.
we take 1 unit for 10 students. We then draw and label the graph as shown in figure.
The bar represent blue colour is tallest so,
(1) Blue colour is most preferred colour.
The bar represent green colour is shortest so,
(2) Green colour is least preferred colour.
(3) 45 students preferred red colour.
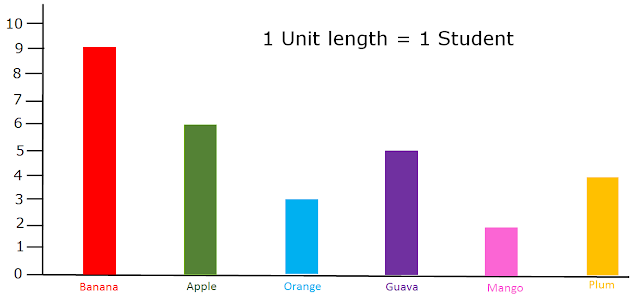
Example: (2) Favourite Fruits of 10 students of a class are given in the below table.
Answer the following questions with the help of the bar graph.
(1) Which is the most preferred fruit and which is the least preferred?
(2) How many students preferred mango and banana?
Answers:
The bar represent red colour is tallest so,
(1) Red colour is most preferred colour.
The bar represent pink colour is shortest so,
(2) Pink colour is least preferred colour.
(3) 2 students preferred mango and 9 students preferred banana.
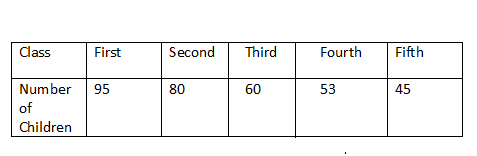
Example (3): Number of children in class first to fifth are given below.
Represent the data on a bar graph, and answer the given questions?
(1) Which class has the maximum number of students?
(2) Which class has the minimum number of students?
(3) How many students in class third?

Answers:
(1) First class has the maximum number of students?
(2) Fifth class has the minimum number of students?
(3) 60 students in class third?
Example: (4) Books sold by a bookstore during consecutive years are given in below bar graph.
Read the bar graph and answer the following questions.
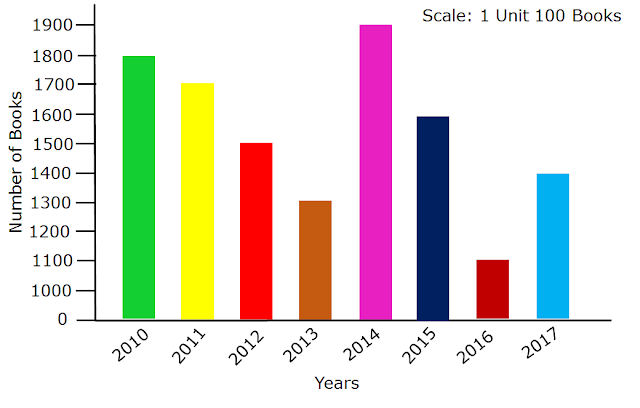
(1) How many books were sold in 2010, 2011 and 2012?
(2) In which year 1300 books sold?
(3) In which year fewest books sold?
(4)In which year highest score of books sold by bookstore?
Answers:
(1) In year 2010, 1800 books sold in 2011,1700 books sold and in 2012, 1500 books were sold.
(2) In year 2013, 1300 books sold?
(3) In year 2016 fewest books sold?
(4)In year 2014 highest score of books sold by bookstore?
Example: (5) Number of children in class first to fifth are given below in a bar graph. Read the bar graph and answer the given questions?

(1) Which class has the maximum number of students?
(2) Which class has the minimum number of students?
(3) How many students in class fourth?
(4) How many students in class first?
Answers:
(1) First class has the maximum number of students?
(2) Fifth class has the minimum number of students?
(3) 200 students in class third?
(4) 450 students in class first ?