What is a Pie Graph or Pie Chart – Definition & Examples with Solutions
Pie Graph or Pie Chart – Definition and Examples
Pie Graph (Pie Chart)
Definition:
A “pie graph or (pie chart)” is a circular chart divided into sectors, each sector represents a proportionate part of a whole.
A pie graph is used to compare parts of a whole. The circle represent the whole.
Sector: In a pie graph, the arc length of each sector(slice) is proportional to the quantity or information it represent.
Central angle: The angle between two radii of a circle is known as the Central angle of the circle.
From geometry, we know that the area of a sector of a circle, must be proportional to the corresponding value of the component.
Therefore, the sum of the all central angles is 3600.
Formula’s
Central angle of the component =(Value of component/Total value) x 3600.
If we need to make any angle into percentage then total angle of pie chart is 3600.
Percentage = (Angle value/3600 x 100)%
How to draw a pie graph or pie chart:
Example: The favorite game of students of a school is given in percentage.
Game Percentage of students
preferring the game
Football 50%
Hockey 25%
Cricket 25%
Let us represent this data in a pie chart.
The total angle at the center of a circle is 360 degree.
Fraction of 360 degree will be the sectors of the central angle.
To find the central angle We make a table of sectors.
Game Percentage In Fraction of
of students fractions 360
Football 50% 50/100=1/2 1/2 of 360=180
Hockey 25% 25/100= 1/4 1/4 of 360=90
Cricket 25% 25/100= 1/4 1/4 of 360=90
Step 1: Draw a circle with any convenient radius.
Step 2: The angle of the sector for football is 180 degree.
Step 3: The angle of the sector for hockey is 90 degree.
Step 4: The angle of the sector for cricket is 90 degree.
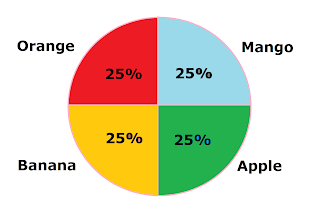
Example: In a group of children, 25% likes orange, 25% likes mango, 25% likes apple, and 25% likes banana.
Let us represent this data in a pie chart.
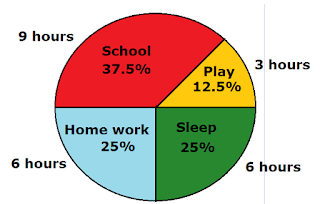
Example: The time spent by a child during a day,
9 hours spent in school, 3 hours spent in play, 6 hours spent in home work, and 6 hours spent in sleep.
Let us represent this data in a pie chart.
The below pie diagram shows the percentage of viewers watching different type of TV channels.

Percentage wise distribution of players who play four different games are given in below pie graph and total number of players are 1200.

Example 1: What is the total number of players who play cricket and rugby?
Solution: Total number of players are 1200,
Percentage of players who play cricket = 12%
Percentage of players who play rugby = 13%
Percentage of players who play both cricket and rugby = 12% + 13%
= 25%
Total number of players who play cricket and rugby = 25% of 1200
= (25/100) x 1200
= 25 x 12
= 300
Therefore, 300 players play both cricket and rugby.
Example 2: What is the difference between number of players who play football and hockey?
Solution: Total number of players are 1200,
Percentage of players who play football = 50%
Percentage of players who play hockey = 25%
Difference of percentage of players who play both football and hockey = 50% – 25%
= 25%
so, the difference in players who play football and hockey = 25% of 1200
= (25/100) x 1200
= 25 x 12
= 300
Therefore, difference between players play both football and hockey is 300.
Example 3: What is the total number of players who play cricket and rugby?
Solution: Total number of players are 1200,
Percentage of players who play cricket = 12%
Percentage of players who play rugby = 13%
Percentage of players who play both cricket and rugby = 12% + 13%
= 25%
Total number of players who play cricket and rugby = 25% of 1200
= (25/100) x 1200
= 25 x 12
= 300
Therefore, 300 players play both cricket and rugby.
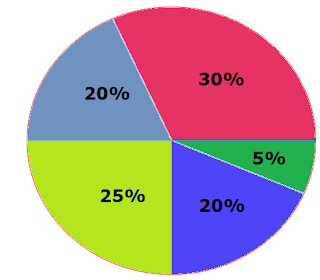
Example 4: The following table shows the percentages of buyers of five different brands of shirts.
Brand A B C D E
Percentage
of buyers 30% 20% 25% 20% 5%
Represent the above data by a pie chart.
Solution: The total angle at the center of a circle is 360 degree.
Fraction of 360 degree will be the sectors of the central angle.
To find the central angle We make a table of sectors.
Brand Percentage In fractions Fraction of 360
of buyer degree
Brand A
30% 30/100 = 1/2 3/10 of 360=108
Brand B
20% 20/100 = 1/5 1/5 of 360=72
Brand C
25% 25/100 = 1/4 1/4 of 360=90
Brand D
20% 20/100= 1/5 1/5 of 360=72
Brand E
10% 25/100= 1/4 1/4 of 360 = 36
Step1. Draw a circle with any convenient radius.
Step2. The angle of the sector for Brand A is 108 degree.
Step3. The angle of the sector for Brand B is 72 degree.
Step4. The angle of the sector for Brand C is 90 degree.
Step5. The angle of the sector for Brand D is 72 degree.
Step6. The angle of the sector for Brand E is 36 degree.
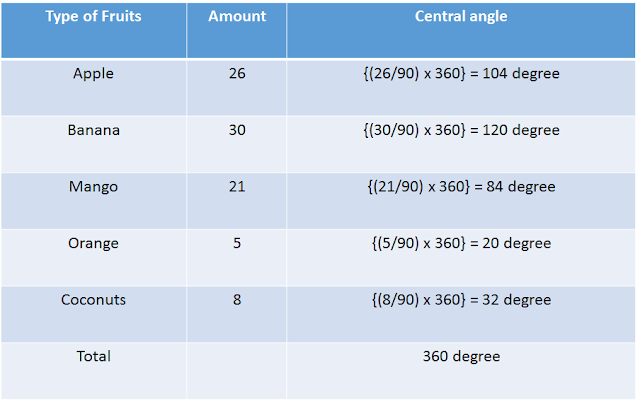
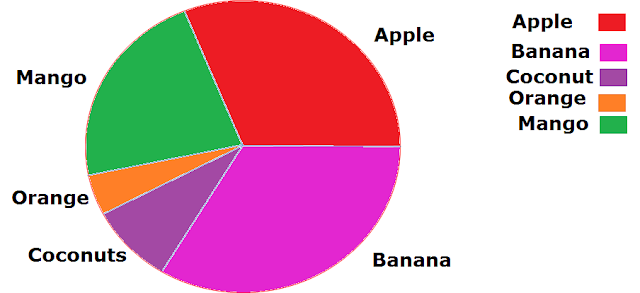
The following table gives the number of different fruits in a hamper. Represent the above data by a pie graph.
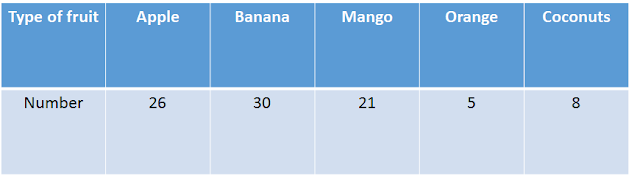
Solution: Total number of fruits = 26 + 30 + 21 +5 + 8
26 + 30 + 21 +5 + 8 = 90
Calculate the central angle