Chart or Graph Definition – Examples – Type of Charts
Chart or Graph Definition – Examples
A chart is a graphical representation of data, in a chart the data is represented by symbols, such as a bar chart represented by bars, pie chart by slices or a line chart by lines.
Type of charts
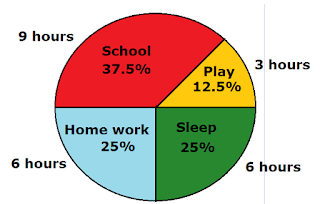
1. Pie chart
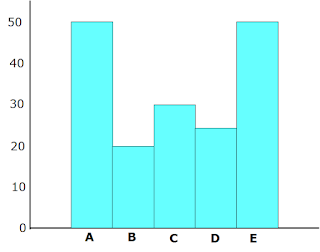
2. Bar chart
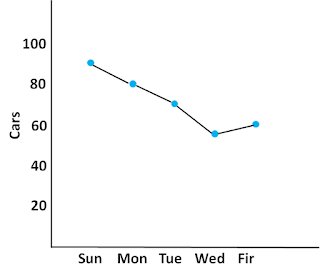
3. Line chart
4. Histogram
1. Pie chart
A “pie graph or (pie chart)” is a circular chart divided into sectors, each sector represents a proportionate part of a whole.
2. Bar chart
In a bar graph data is presented in horizontal or vertical rectangular form. A bar graph has two axis, one is horizontal and other is vertical. Bars can be drawn horizontally or vertically with equal spacing between them.

3. Line chart
A line graph is a type of a graph which show how data or information change over time. A line graph is also known as line chart.
4. Histogram
A histogram is from of graphical representation of grouped frequency distribution with continuous classes.