Line Graph – Definition & Examples
Line Graph – Definition & Examples
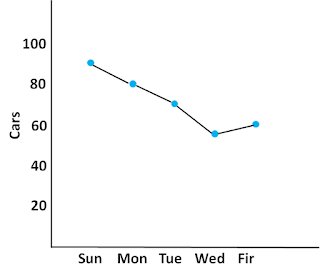
A line graph is a type of a graph which show how data or information change over time.
A line graph is also known as line chart.
Example: The table shows the sell of cars in a shop for five days. Draw a line graph.
Example: The table shows the number of students in a school. Draw a line graph.


