How to Plot Points on Cartesian Coordinate System
Plot Points on Cartesian Coordinate System

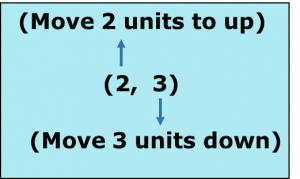
Example: Plot the point (2, 3) and identify its position in which quadrant is located.
First we will place a dot at the intersection of X and Y axis, which is the center of the Cartesian coordinate and known as the origin.
From the origin, move 2 units going right.

Our point is (2,3), here x = 2, and value of x is the first number in the ordered pair and first number x represents the point’s horizontal position, so we will move 2 units right from the origin.

now our point is (2, 3), here y = 3 and value of y is the second number in the ordered pair, and second number y represents the point’s vertical position, so we will move 2 units going up to parallel to the main vertical axis from the origin.

Therefore, point (2, 3) look like this, and located in first quadrant.

Example: Plot the point (3, 0) and identify its position in which quadrant is located.

The point B is 3 units distance from Y axis and zero distance from X axis.
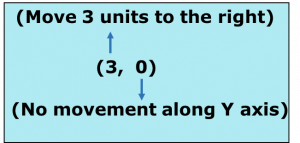
Therefore, the x – coordinate of B is 3 and the Y – coordinate is zero.
Hence, the coordinate of B are (3, 0)
The plotted point is neither in I quadrant nor in II quadrant.
Therefore, point (3, 0) look like this, and located in is along the positive x axis.

Example: Plot the point (3, 0).
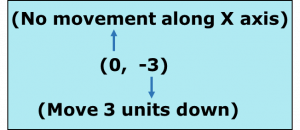
The point B is -3 units distance from X axis and zero distance from Y axis.
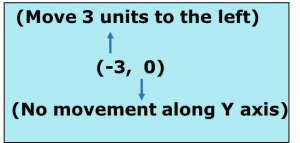
Therefore, the Y – coordinate of B is -3 and the X – coordinate is zero.
Hence, the coordinate of B are (0, -3)

Example: Plot the point (0, -4).

Example: Plot the point (0, 4).

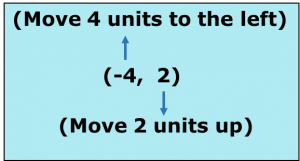
Example: Plot the point (-4, 2)

Example: Plot the point (1, 4) and (-2, 3)

Example: Plot the points (4, 5), (-4, 5), (-4, -5), and (4, -5).

Example: Plot the points (4, 1), (-3, 4), (-3, -4) and (0, -3)
