What is Range – Definition – Examples – Formula – Statistics
Range – Definition – Examples – Formula – Statistics
Definition:
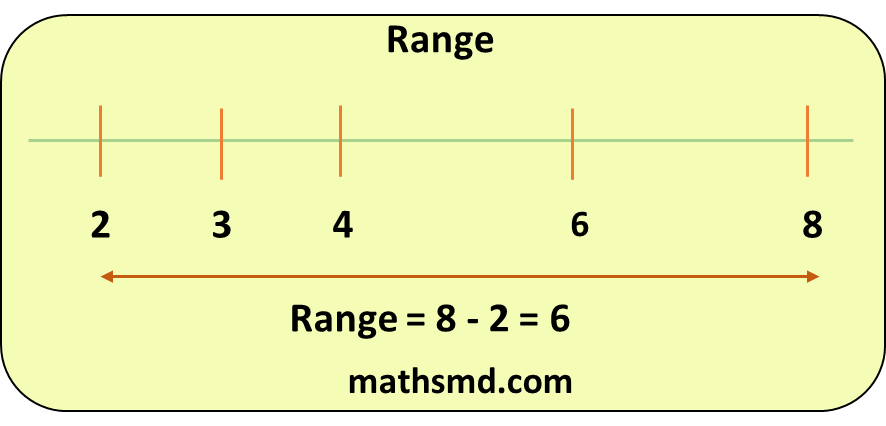
In statistics and mathematics, range is defined as the difference between the highest and lowest value in a set of data.
Range Formula
The formula for the range is the highest(maximum)
value minus lowest(minimum) value in a data set.
Range = Highest value – Lowest value or,
Range = Highest observation – Lowest observation or
Range = Maximum value – Minimum value
How to find range in statistics?
In statistics to find the range of given observation, we need to arrange the set of data or given values or set of observations in ascending order.
That means write the observations from the lowest to highest value. Now we apply the formula.
Example: In the data set 5, 9, 1, 3, 8, 2, 7, 5, 9, 5, 12, 10, 7, 8, 4.
Find (a) The maximum value?
(b) The minimum value?
(c) Range of data set?
Solution: Let us first arrange the given observations in ascending order.
1, 2, 3, 4, 5, 5, 5, 7, 7, 8, 8, 9, 9, 10, 12
From the above observation, we can conclude that ;
(a) maximum value is 1
(b) minimum value is 12
therefore, the range will be ;
Range = maximum value – minimum value
= 12 – 1
= 11
Hence, 11 is the answer.
Example: Find the range in the set {1, 3, 7, 4, 9}
the highest value is 9, and lowest value is 1,
Range = Highest value – Lowest value
Range = 9 – 1
so, the Range is 9 – 1 = 8
Example: Find the range in the set {10, 13, 27, 4, 19}
the highest value is 27, and lowest value is 4,
Range = Highest value – Lowest value
Range =27 – 4
so, the Range is 27 – 4 = 23
When numbers are negative
Example: Find the range in the set {1, -3, 8, 5, -2, 8},
the highest value is 8, and lowest value is -3,
If there are negative numbers in the set, then find the range carefully because subtracting a negative number is the same as adding the positive number
so, the Range is 8 – (-3)
= 8 + 3
= 11